Multi-timeframe analysis transforms confusion into structure — giving you the full picture of where price is coming from, where it is now, and where it is most likely to go next
A long-form authority guide on synchronizing trends, liquidity, and momentum across multiple timeframes
One of the biggest differences between beginner and professional analysis is how they view the chart. Beginners zoom in and out randomly, trying to “guess” direction. Professionals read the market through a systematic relationship between timeframes.
Multi-timeframe alignment reveals the full architecture of the trend. It shows how higher timeframe intention and lower timeframe execution work together.
This guide teaches you to build a clear market map using cross-timeframe structure.
No timeframe is enough on its own — structure becomes consistent only when the layers align
Why Multi-Timeframe Structure Is the Foundation of Professional Technical Analysis
Multi-timeframe mapping reveals:
the dominant trend
the transitional zones
the local execution patterns
the liquidity targets on every level
the relationship between macro pressure and micro confirmation
When timeframes synchronize, the market becomes readable and actionable.
Every timeframe has a specific job — know it, and structure becomes simple
Understanding the Role of Each Timeframe Category
Higher Timeframes (HTFs):
define the macro trend
reveal major liquidity pools
show institutional positioning
highlight long-term imbalances
identify true directional bias
HTFs = intention
Medium Timeframes (MTFs):
reveal trend development
connect macro with micro
track momentum consistency
refine liquidity targeting
MTFs = progression
Lower Timeframes (LTFs):
provide precision entries
show micro structure breaks
expose intraday traps
assist in confirmation
LTFs = execution
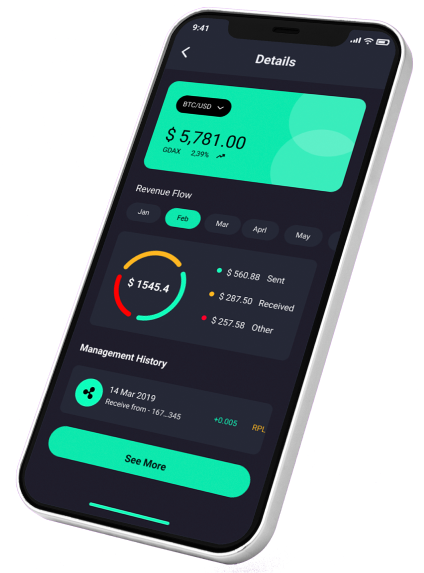
Portfolio Strategy Built Around Your Goals
Receive a complete, coin-by-coin analysis of your portfolio with structured risk evaluation, allocation guidance, and clear improvement suggestions. Turn scattered holdings into a disciplined, strategic investment plan.
Trend clarity emerges when all layers speak the same language
The Principle of Cross-Timeframe Confirmation
A strong directional setup requires:
HTF trend alignment
MTF structural cooperation
LTF confirmation or refinement
If one timeframe contradicts others, the setup becomes lower probability.
Cross-confirmation eliminates noise and forces disciplined decision-making.
Each timeframe holds its own liquidity architecture — together they form a hierarchy
Mapping Liquidity Across Multiple Timeframes
Liquidity mapping should include:
macro swing highs & lows (HTF)
internal trend liquidity (MTF)
intraday sweeps (LTF)
imbalance clusters across layers
This structure reveals which liquidity target will be hit first — and which target will matter most.
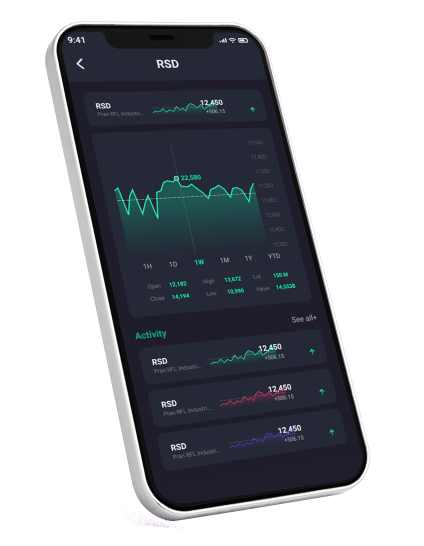
Targeted Altcoin Analysis for Smarter Decisions
Get a manually crafted, expert-level breakdown of any altcoin you choose. Understand market structure, fundamentals, risk areas, and potential scenarios with clarity — no noise, no guesswork, just professional insight.
Confluence removes randomness. It builds conviction based on structure — not emotion.
HTF creates the direction — LTF decides the timing
Using Multi-Timeframe Mapping for Entry and Exit Precision
Professionals follow this simple rule:
Direction: HTF
Context: MTF
Entry: LTF
This sequence reduces drawdown, improves precision, and increases clarity.
Final Evaluation & Strategic Takeaways
Multi-timeframe alignment is one of the strongest frameworks in professional technical analysis. By synchronizing structure across HTF, MTF, and LTF, you gain:
clear directional bias
deeper liquidity understanding
accurate trend interpretation
precision in entries and exits
control over emotional decision-making
When market layers align, uncertainty disappears. This is how you build a structured, repeatable analysis system — the kind that professionals trust and beginners overlook.
Understand the Market Before It Moves
Get a professional overview of market structure, macro behavior, dominance trends, and major cycles. Designed for traders who want clarity on the broader environment before making critical decisions.